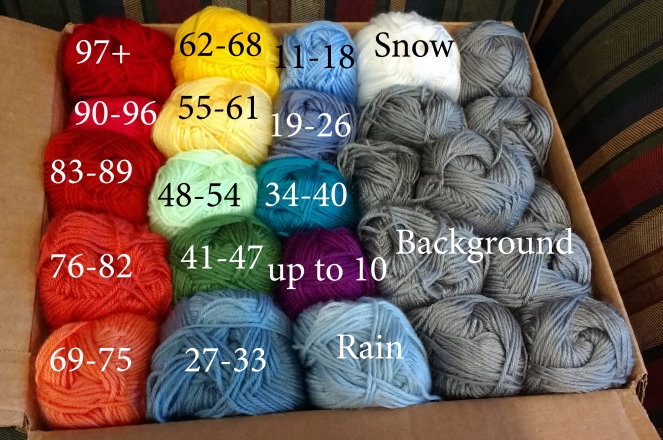
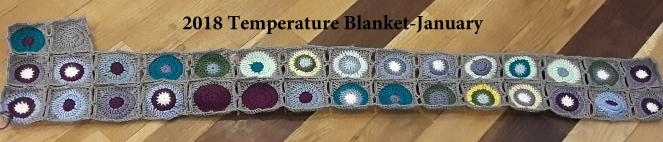
I did it! One whole month of temperatures and precipitation have been tracked using my crazy, difficult plan. Each square represents one day. The center circle is either rain, snow, or low temperature. The second is low temperature or high temperature. The outside circle is the high temperature. See this post for the pattern.
What about the gray circle? That’s my month divider! Fortuitously, when I figured out my blanket would be 15 squares by 25 squares, I had ten squares left over–perfect for putting a separation between the months!
This pattern is worked from left to right and bottom up. Like this:
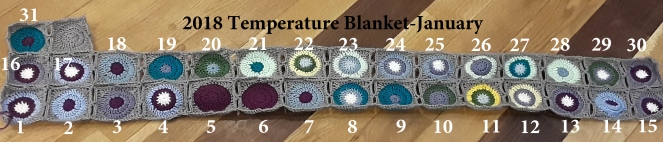
My first February square will be above the 18.
I feel like January has had multiple personalities. We have had some very cold weather (see blocks 5 and 6 where the temperature never made it above 10 degrees), and some warm, we-don’t-even-need-jackets days (see day 11 when the high was 63 degrees). It is definitely an interesting, visual way to chart the temperature.
It has snowed a number of days. You can’t tell the difference from the days we got less than an inch and the day we got 18 inches, but that’s ok. I woudn’t want to make the blanket and tracking any more difficult!
It will be interesting to see what February brings. Will this crazy up and down pattern continue? Will we get a long cold snap? Will we have an early spring? My day lilies are starting to come up already, so they are certainly confused.
Who else is doing the temperature blanket? What do your colors look like? I’d love for you to post pictures in the comment section.
Here’s a reminder of what my colors stand for. I’ve used all but five already!